
Every time I open this project I can’t help but work on the next component, but for the purposes of this week’s assignment, a preliminary version is here.
The Intercept recently published a series of articles based on leaked documents obtained detailing U.S. government [attempted] assassinations of targets in Afghanistan, Yemen, and Somalia. Already intrigued by what information might be publicly available related to this covert war, one of the ICM homework links, one of Jer Thorp’s blog posts, Art and the API included information on a project which collected information on U.S. Drone strikes:
“Josh Begley, a data artist living in New York, has recently created an API which allows access to information on every US drone strike, using data from The Bureau for Investigative Journalism. Updated as new strikes are reported and confirmed, The API allows others access to verified and aggregated data on drone activity.”
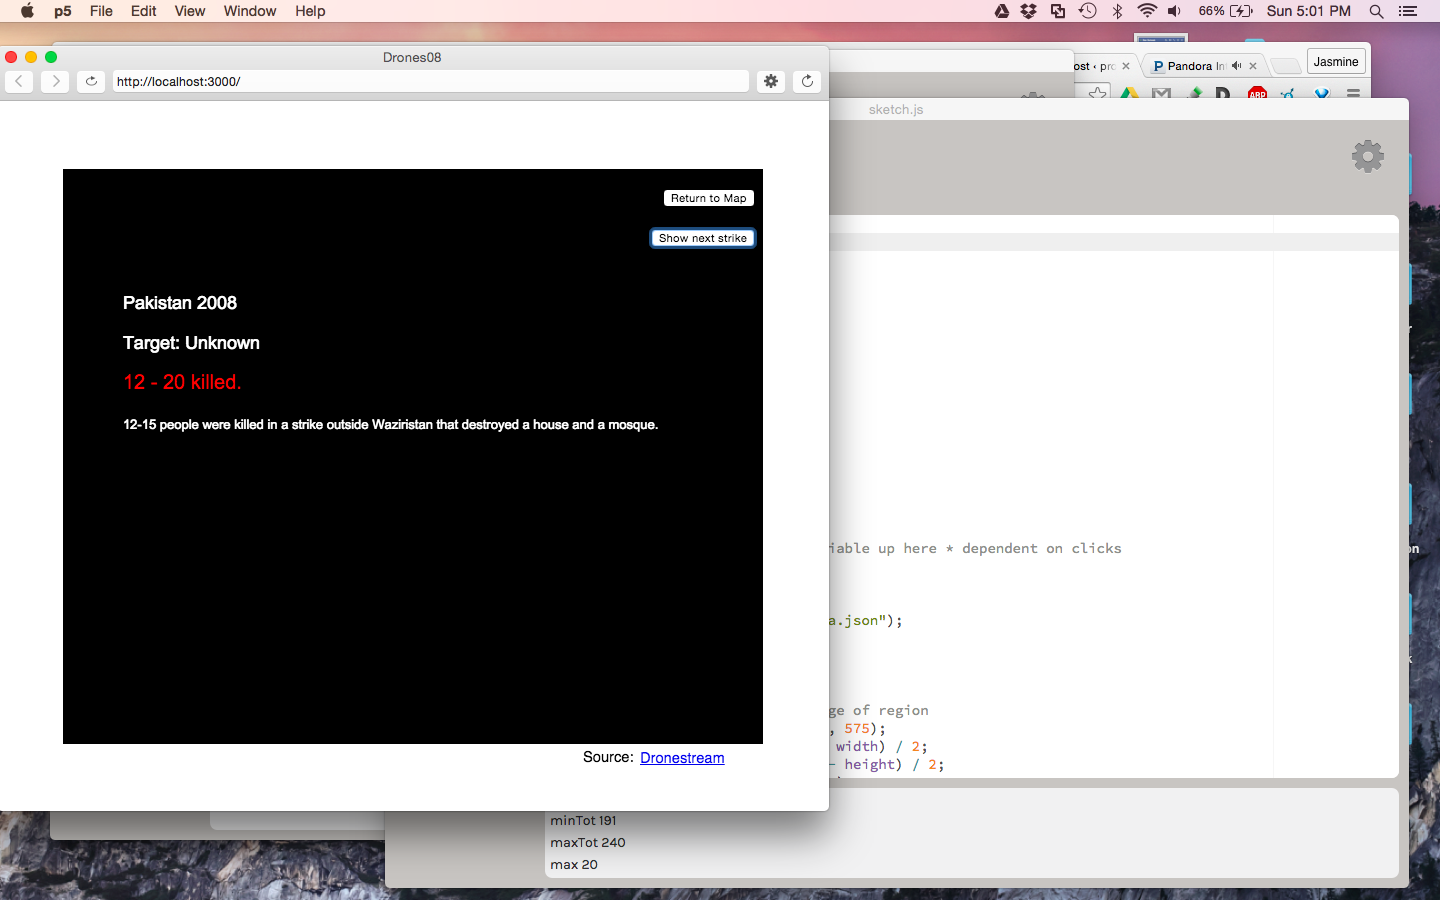
I ended up using data from Dronestream to create a website where you could click on a country to chronologically look through information on drone strike deaths in that country.
Challenges
I process data with SAS professionally but working with data in JavaScript is a whole other thing. Also, these data are called an “API” but I had a lot of trouble using it as such–I ended up preloading the data as a JSON file. To make sure I wasn’t doing anything wrong, I used my API code to call weather data, and confirmed that it worked for that. Someone e-mailed the ICM listserv re: an API that wasn’t “live” and I think this may have been the issue I was encountering. But yeah, this website isn’t live-updating (not that drone strikes are confirmed as such and added that often).
I kept wanting to restructure the file in familiar ways, but then would stubbornly force myself to work with the data as a JSON for the learning experience. For example, in SAS, I’d just create a data set or other variable that included all the cumulative numbers I was interested in. It doesn’t seem efficient to recalculate them every time the program is run?
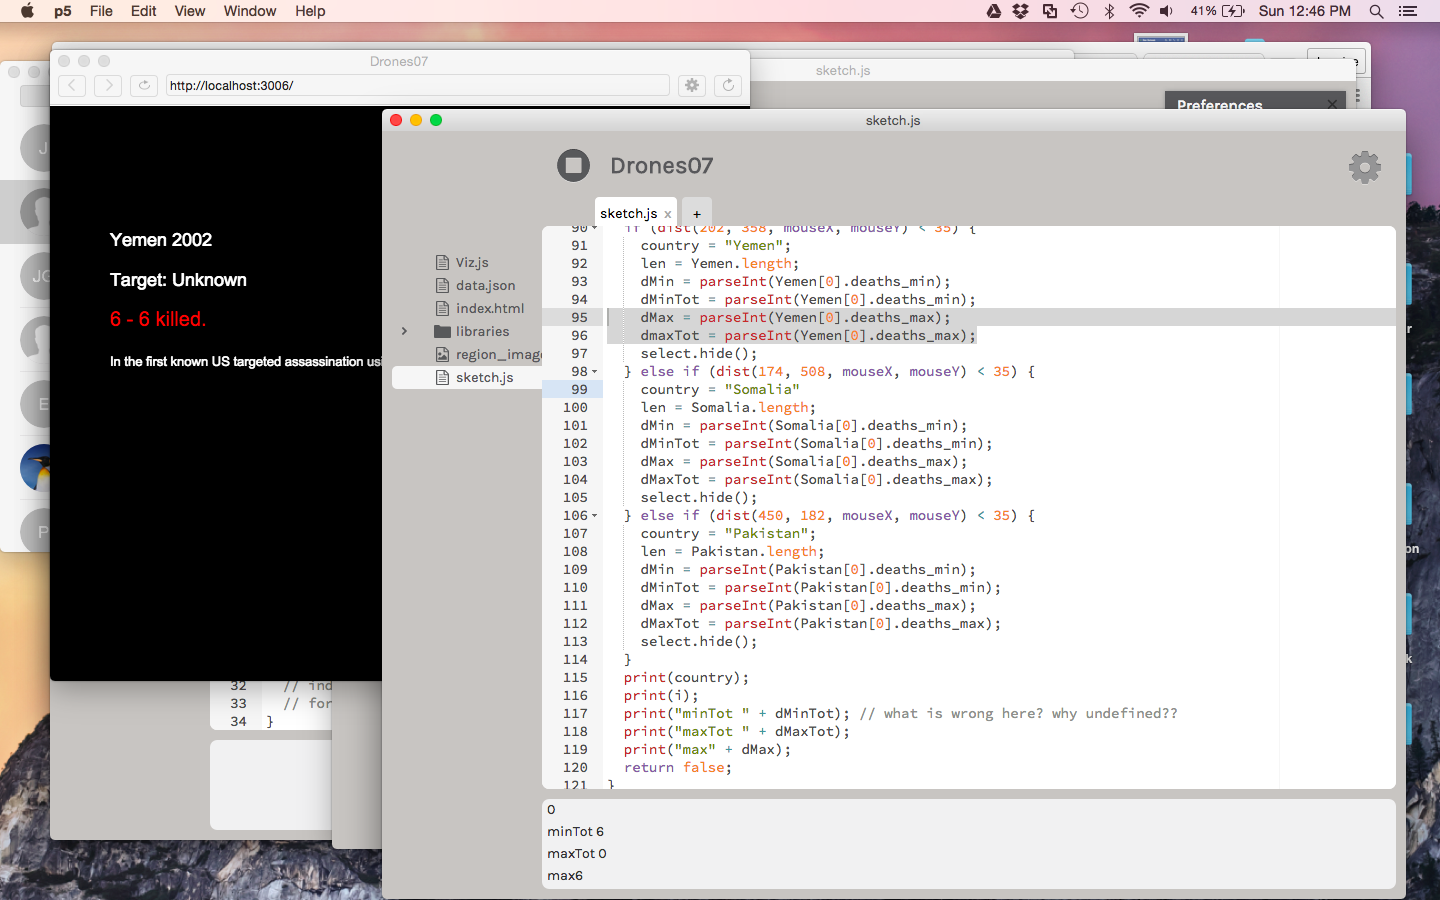
Creating cumulative numbers, a typo caused me some headaches
Sometimes bad data caused unexpected results. JavaScript doesn’t like converted empty data or special characters into numbers.
I learned to use parseInt, the .substring() method, and got much better at incorporating DOM elements!
Future Improvements
A few things are still obviously wrong with the way the sketch currently functions.
- The code is a mess. I kept meaning to modulate the code and pull out pieces into a separate file to include on their own in my index, but I kept working on improving and adding other things that intersected, I never did this basic organizing.
- Text does not wrap: a few of the really long narratives and lists of targets run off the screen because of this.
- I learned this week a bit more about customizing DOM elements, and I think the buttons and general look of the website might be improved with this new knowledge, and a bit more research on what’s possible.
- For some reason (I RESET MY INDEX VARIABLE I SWEAR!) once you click on a country, it doesn’t loop back to i=0 when you reach the end. I haven’t figured out why this isn’t working yet. To make matters worse, once you’ve broken this piece, the “Return to Map” button doesn’t fully reload the main page properly. Why!?
- My original idea was to include an actual visualization! Pakistan has so many drone strike deaths that I think I might need to restructure my entire page in order to accommodate the cumulative number of deaths on the page. Also working out the array to function as I’d like them to requires a bit more work. I need to do more homework using the Getting Started with P5 book and web sources available in order to figure out how to (1) set hardcoded spots for the silhouettes of the killed as they accumulate (2) make clear the apparent difference between the minimum estimated dead and the maximum estimated dead.
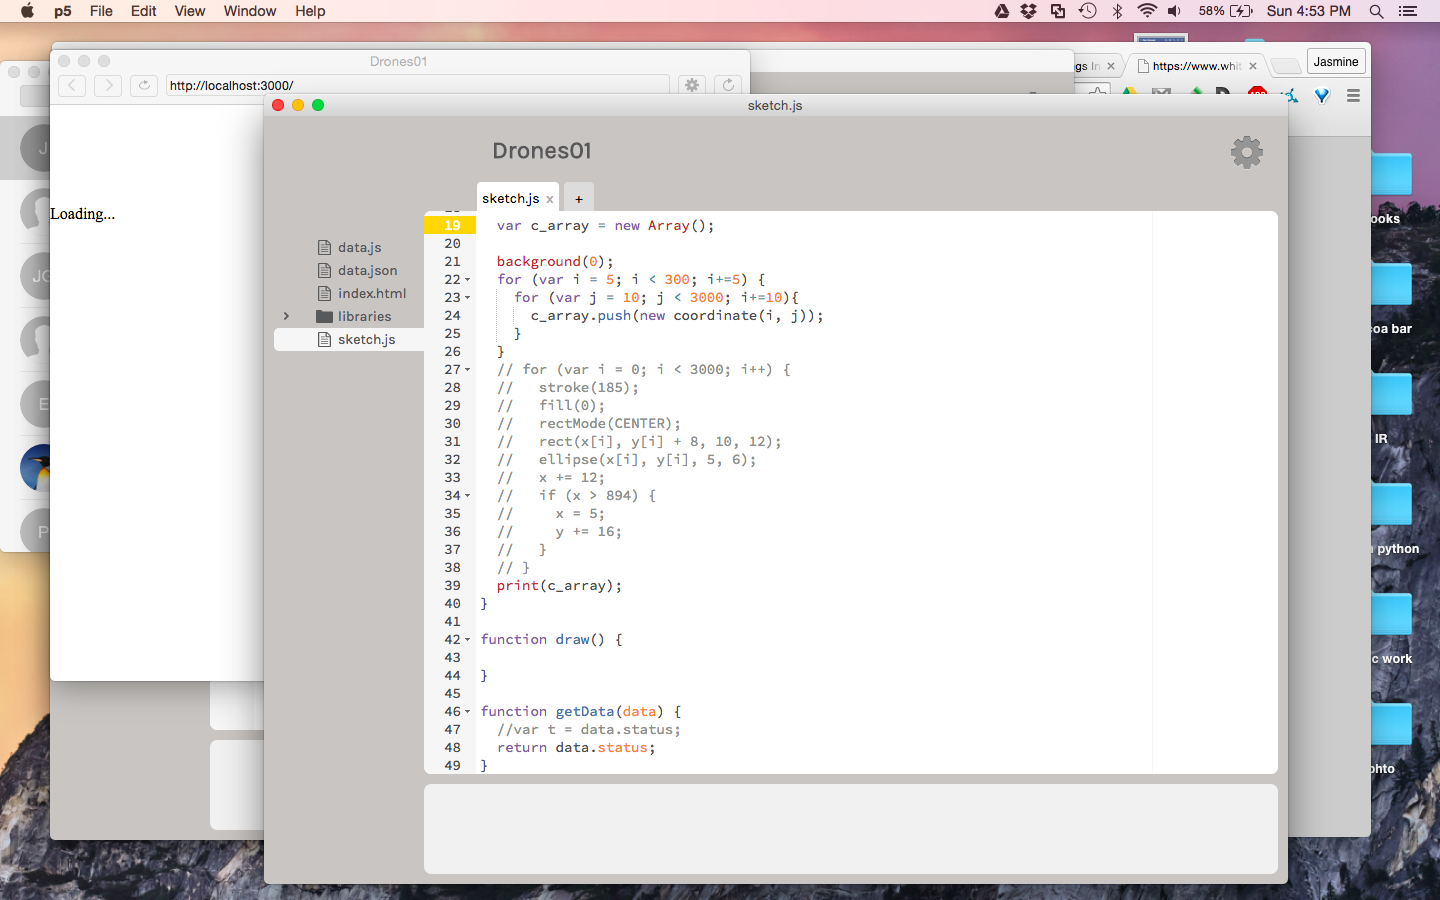
In an initial attempt to make an array for hardcoded silhouette positions, I think I accidently made an infinite loop or something
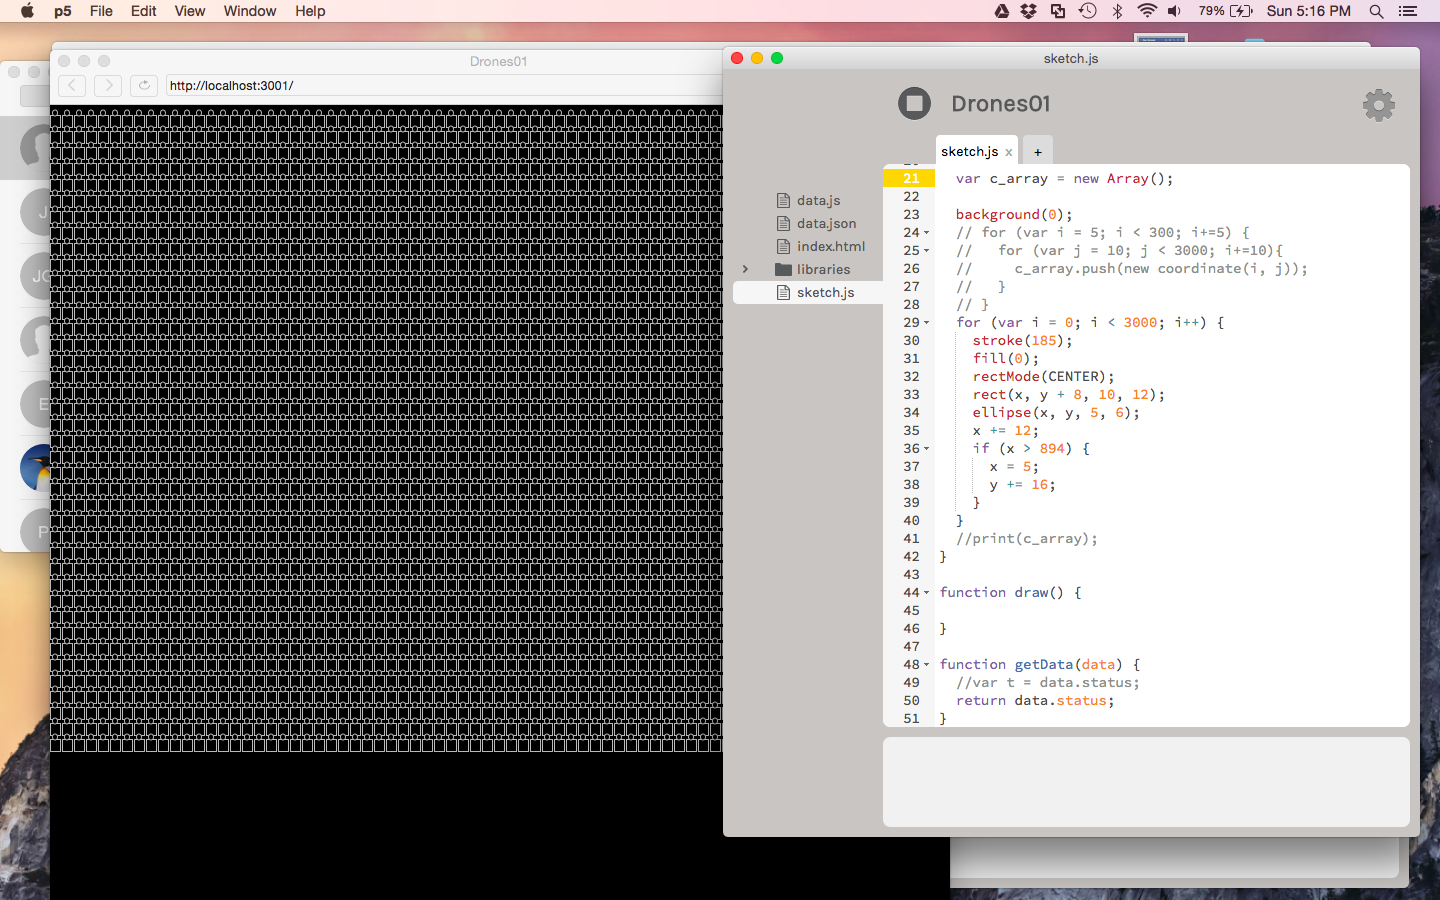
Silhouettes to incorporate
- Finally, if I turn this into a final project I’d also like to incorporate more background and data from the U.S. government.